TL;DR: Use all of the cool examples with your own data, while keeping that data local or inside your network.
If you haven’t heard of it, Observable is a platform for interactive coding brought to the world by Mike Bostock, creator of d3. It embodies a bold vision of reactive programming from Bret Victor and frankly, I think it’s cool as hell. One drawback: I’m not the best at Javascript, the core language. I’m pretty darn good at it, don’t get me wrong, but I’m continually impressed at the things people do on Observable. At the risk of repeating the excellent guides from the Observable team, I’ll just share a concrete example.
If you get stuck on my guide, the definitive references are Introduction to Embedding, Advanced Embedding and Downloading, and Troubleshooting Embedding.
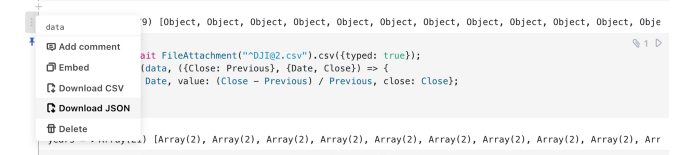
Now let’s get going. There are two excellent example visualizations from Mike Bostock showcasing d3: Line Chart with Tooltip and Calendar View. I was showing my UC Berkeley MIDS class the latter, and we were curious what the data shown in the calendar view would look like in the line chart. Start by downloading the data from the calendar view:
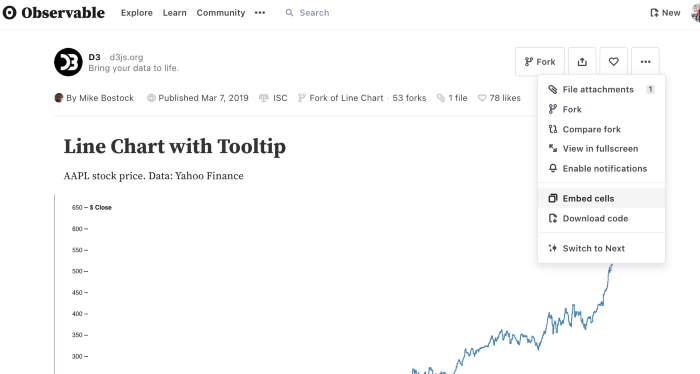
Now that we have the data, let’s create the embed. From the line chart, click the three dots in the top right and select embed:
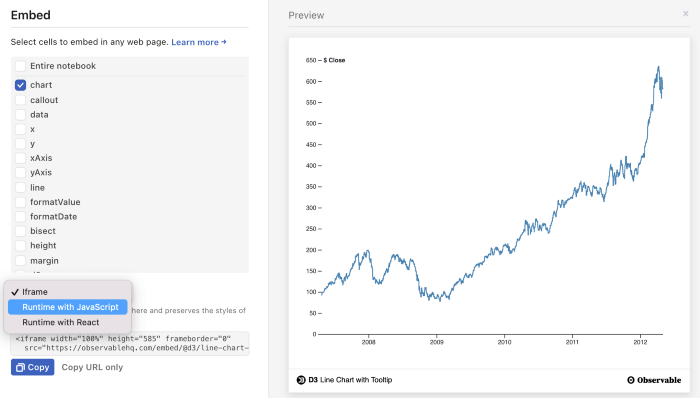
Now we just want the chart, so select only the chart. Make sure get “Runtime with JavaScript” so we can override the data.
You should now have that snippet of code:
<div id="observablehq-chart-22ee36d2"></div>
<p>Credit: <a href="https://observablehq.com/@d3/line-chart-with-tooltip">Line Chart with Tooltip by D3</a></p>
<script type="module">
import {Runtime, Inspector} from "https://cdn.jsdelivr.net/npm/@observablehq/runtime@4/dist/runtime.js";
import define from "https://api.observablehq.com/@d3/line-chart-with-tooltip.js?v=3";
new Runtime().module(define, name => {
  if (name === "chart") return new Inspector(document.querySelector("#observablehq-chart-22ee36d2"));
});
</script>
Fire up an empty index.html next to the data.json that you already downloaded,
and we’ll wrap that embed in an HTML container
(in my Atom editor, I just type html and use the completion to get the “shell”).
It should look like this:
<!DOCTYPE html>
<html lang="en" dir="ltr">
    <head>
        <meta charset="utf-8">
        <title></title>
    </head>
    <body>
        <div id="observablehq-chart-b01c95fe"></div>
        <script type="module">
        import {Runtime, Inspector} from "https://cdn.jsdelivr.net/npm/@observablehq/runtime@4/dist/runtime.js";
        import define from "https://api.observablehq.com/@d3/line-chart-with-tooltip.js?v=3";
        new Runtime().module(define, name => {
            if (name === "chart") return new Inspector(document.querySelector("#observablehq-chart-b01c95fe"));
            return ["x","y","yAxis","bisect","  xAxis","line"].includes(name);
        });
        </script>
    </body>
</html>
Now we’ll load the data, by first loading the d3 library and using it to get the JSON file:
<!DOCTYPE html>
<html lang="en" dir="ltr">
    <head>
        <meta charset="utf-8">
        <title></title>
    </head>
    <body>
        <div id="observablehq-chart-b01c95fe"></div>
        <script src="https://d3js.org/d3.v7.min.js"></script>
        <script type="module">
        import {Runtime, Inspector} from "https://cdn.jsdelivr.net/npm/@observablehq/runtime@4/dist/runtime.js";
        import define from "https://api.observablehq.com/@d3/line-chart-with-tooltip.js?v=3";
        const main = new Runtime().module(define, name => {
            if (name === "chart") return new Inspector(document.querySelector("#observablehq-chart-b01c95fe"));
            return ["x","y","yAxis","bisect","  xAxis","line"].includes(name);
        });
        d3.json("data.json").then(function(d) {
            [next bit goes here]
        });
        </script>
    </body>
</html>
Okay, I did more than just load d3 and the data.
See what else?
I also stuck the runtime in a variable that I called "main" with const main = ....
Finally,
we just need to override the data on that runtime,
once it’s loaded.
To avoid repeating the whole block of code again,
we’ll just replace [next bit goes here] with our override.
Let’s do it,
first making Date objects out of the dates and adding the axis label,
then overriding the data:
const newData = Object.assign(d.map(({date, close}) => ({date: new Date(date), value: close})), {y: "$ Close"});
main.redefine("data", newData);
And it should work!
Since we’re requesting data.json from the local filesystem,
to view the index.html file you’ll need a local server
(your browser is protecting you from malicious JS files!).
Out of ease, I usually just spin up a python server with
python3 -m http.server
while navigating on over to http://localhost:8000/ to see the finished product:
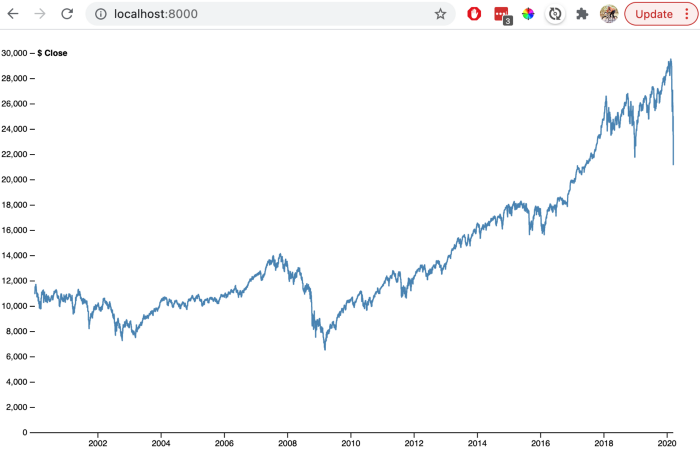
Cheers!